
Till Keyling
Monday, September 25, 2023
Tracking the Summit Race: Serverless Geotracking with Python and GCP
This year, I had the opportunity to build the tracking and scoring system for the Summit Race, a Hike & Fly competition in the Chiemgau Alps. The challenge? Track over 30 pilots in real-time as they race to tag designated mountain peaks, calculate their scores instantly, and visualize their progress on a 3D map for spectators.
The Challenge
The Summit Race rules are simple but technically somewhat demanding to track, even though the concept itself is pretty simple: Reach as many designated peaks as possible (via foot or flight).
Participants carry Flymaster GPS Trackers, which are dedicated, highly specialised GPS-Devices specifically targeted toward Paragliding-competitions.
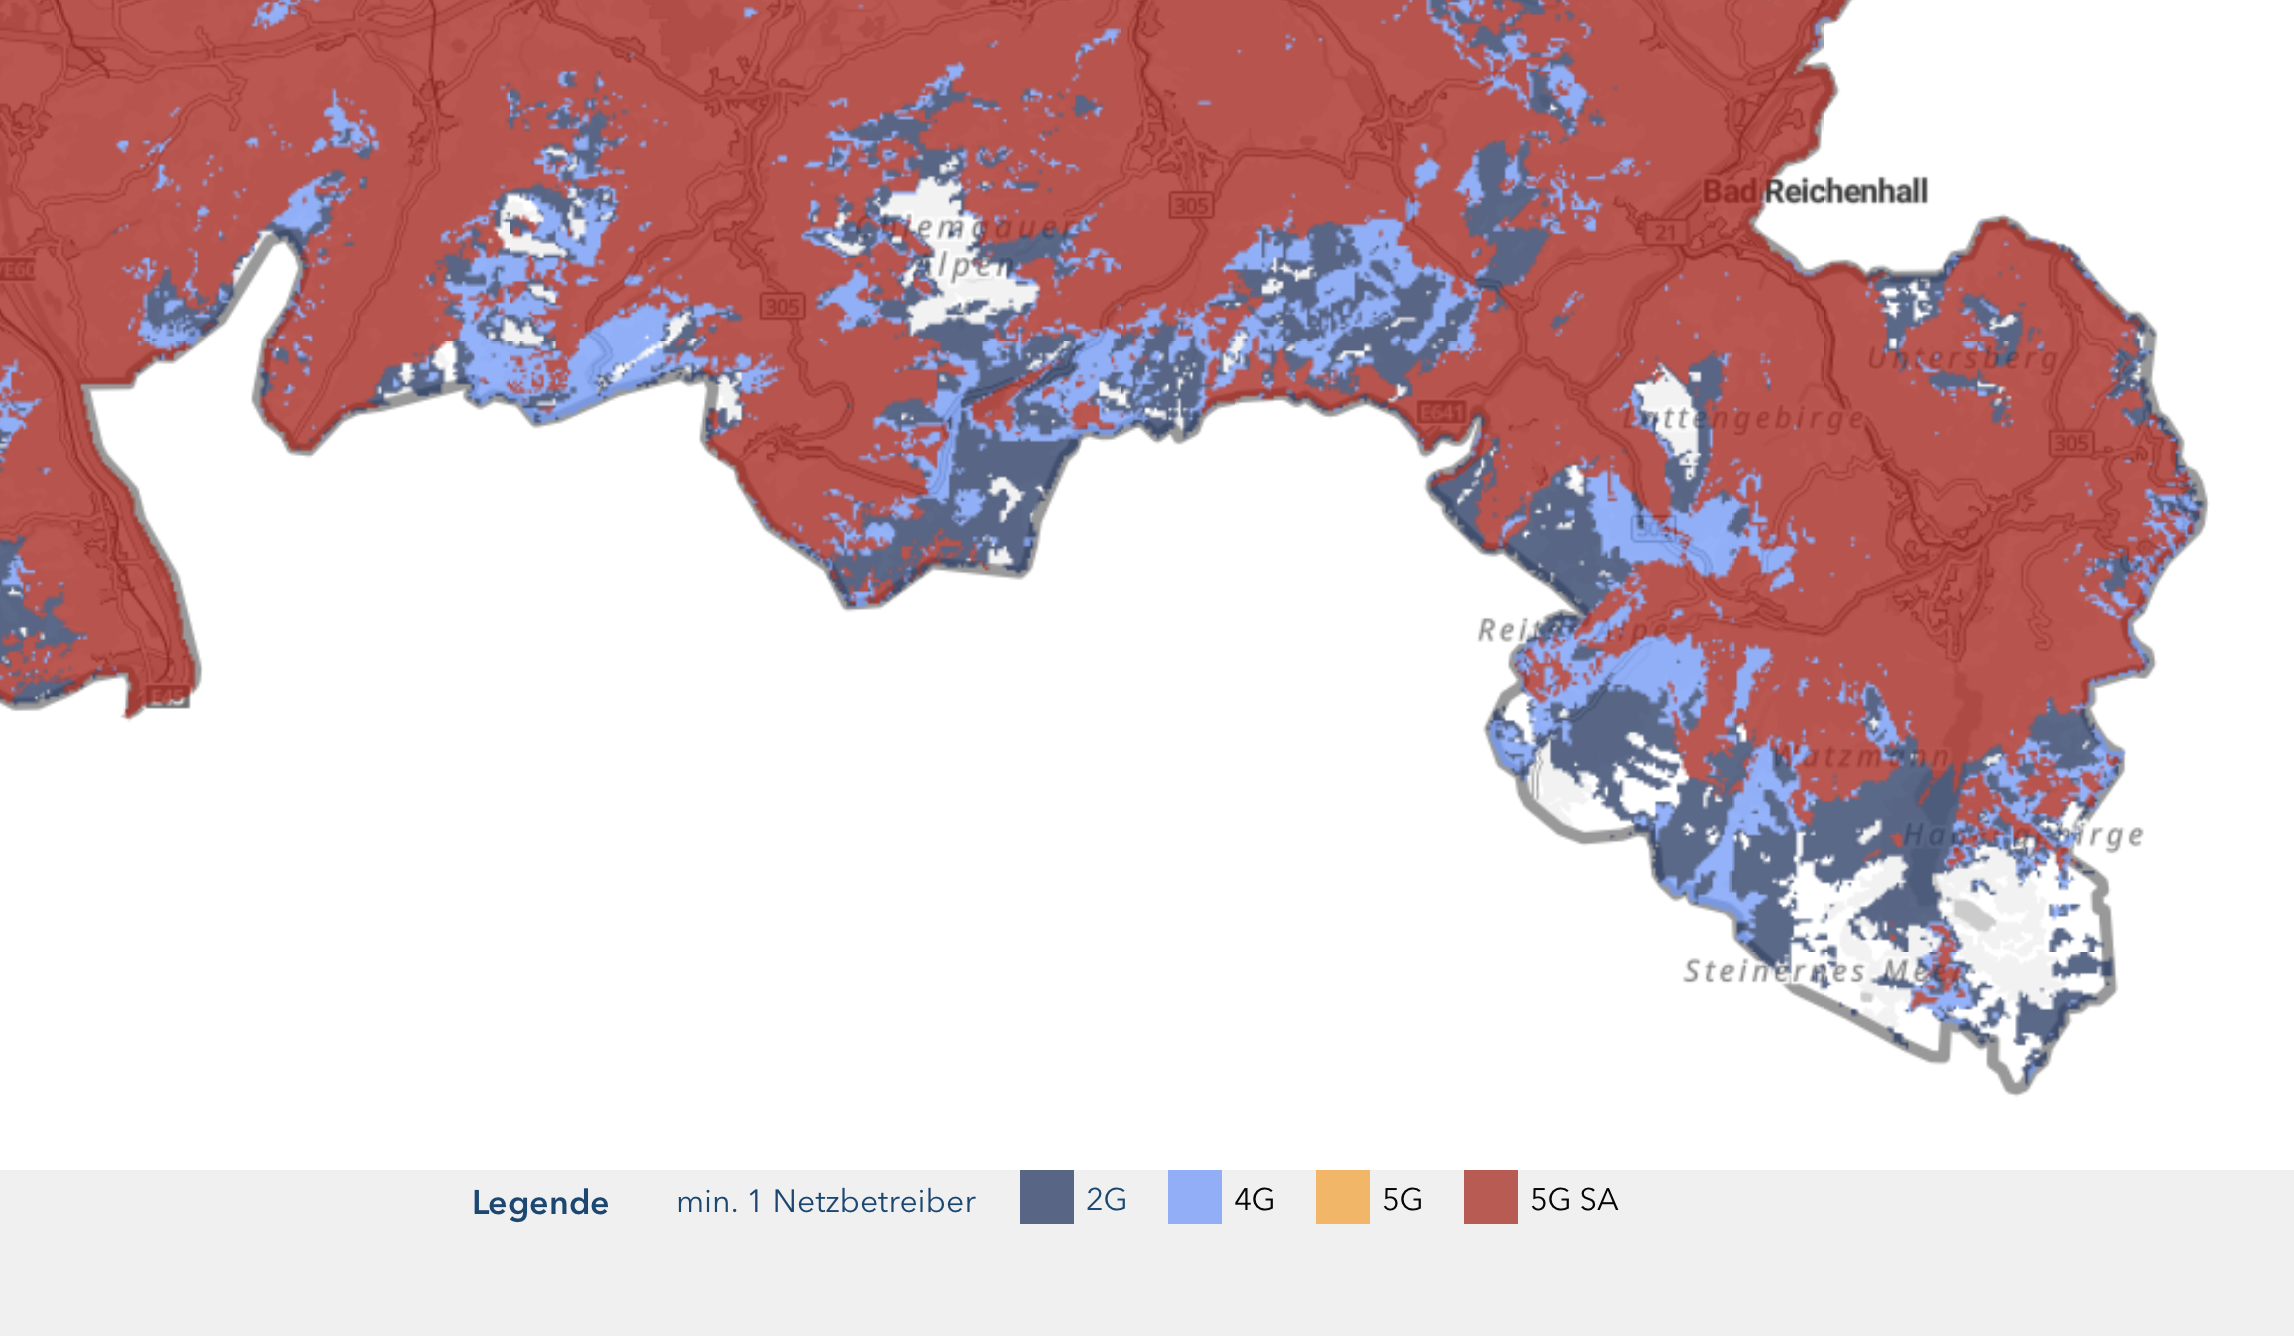
A benefit of these devices, compared to f.e. solutions involving smartphones: Less batterery drainage, certified ICG-Files and very robust near-realtime delivery even in regions with a spotty cell-phone coverage (which is still an issue even is densely populated regions of the north-eastern alps, especially in bavaria.) Flymaster achieves an “eventual-consistent” delivery of tracking-points by using a clever caching mechanism, as well as some clever tricks of using the 2G-cellular bands (basically squeezing in data-points within spare parts of the data-packages)
One peculiarity of the Summit Race, especially compared to scoring-logics of traditional paragliding-competitions (FAI´s “race to goal” etc.) is that each peak has a specific point value: A pilot “tags” a peak if they enter a cylindrical zone (radius: 200m) around the summit.
There is furthermore no restriction on the order of tagging the peaks - thus a strategic planning of the contestants in which order to tag which peaks is a huge contributor to being success, last not least highly depending on the actual weather situations, including thermal activity, flight skills and/or the ability to walk long(er) distances.
The Science of Peak Scoring
We started with a curated list of candidate summits, but we faced a critical question: How many points should each peak be worth? Assigning values arbitrarily felt unfair. We needed an objective way to grade the difficulty of each target, and metrics such as prominence and dominance from the realm of topography came into play:
“Peaks with high prominence and dominance—and thus high significance—are recognizable to the mountain goer, even without measuring tools, by the fact, if not the feeling, that they are impossible to pick up in passing during a traverse. Such mountains must, without exception, be won individually. They never stand connected in a single high ridge with conveniently low notches.” — TheHiRisePage.com
After various experiments with different scoring-mechanics, we ended up with two factors contributing to the score of a peak:
- Topographic Prominence: A measure of how “independent” a peak is from its higher neighbors.
- Distance to Goal: Rewarding pilots for venturing further into the course.
Our (actually pretty simple) algorithm calculated a raw score using a formula that combined logarithmic prominence and distance, then normalized these values and binned them into a 1-5 point scale. This ensured that a massive, remote summit like the Watzmann Mittelspitze (5 points) yielded a higher reward than a smaller, accessible hill like the Osterbuchberg (1 point).
Another benefit of this scoring logic is it´s invariance to the method of transportation: Peaks with higher topographic indipendence are not only hard to reach by foot, but usually by a paraglider as well. A visual confirmations with popular paragliding maps such as the KK7 Thermal Maps supports this hypothesis.
Data Ingestion & Backend
Architecture Overview
The backbone of the system is hosted in the Google Cloud Platform (GCP), leveraging Cloud Functions for serverless compute and Cloud SQL (PostgreSQL) for data storage. The backend was built using Python with SQLAlchemy for the retrival and persistence of data, and GeoPandas for geospatial operations (see below).
Data Ingestion: Incremental Polling
Since Flymaster doesn’t support webhooks for this tier, we choose to poll their getLiveData.php endpoint (it´s documentation is somewhat sparse, but a direct contact with their support/owner helped a lot) every minute to fetch the latest GPS points for all active trackers.
To keep this efficient and minimize bandwidth, I implemented incremental polling. Instead of fetching the entire flight history every minute, the system sends the timestamp of the last known fix (last_fix_sec) for each tracker. The API then returns only the new data points generated since that time.
The Scoring Engine: GeoPandas to the win!
This is where Python shines. Instead of complex SQL geospatial queries, I utilized GeoPandas to perform spatial joins in memory.
When scoring runs, we fetch the latest track points and the list of peaks. We convert both to GeoDataFrames and check for intersections.
Optimization: Incremental Scoring Just like the data ingestion, the scoring engine is optimized for speed. For the live leaderboard, we don’t re-calculate the pilot’s entire path every minute. The system only retrieves and processes the new GPS points arriving since the last scoring run. This keeps the “Serverless” execution time—and cost—flat, regardless of how long the race goes on.
This approach allowed us to tweak scoring rules (e.g., altitude buffers) purely in Python code without migrating database schemas
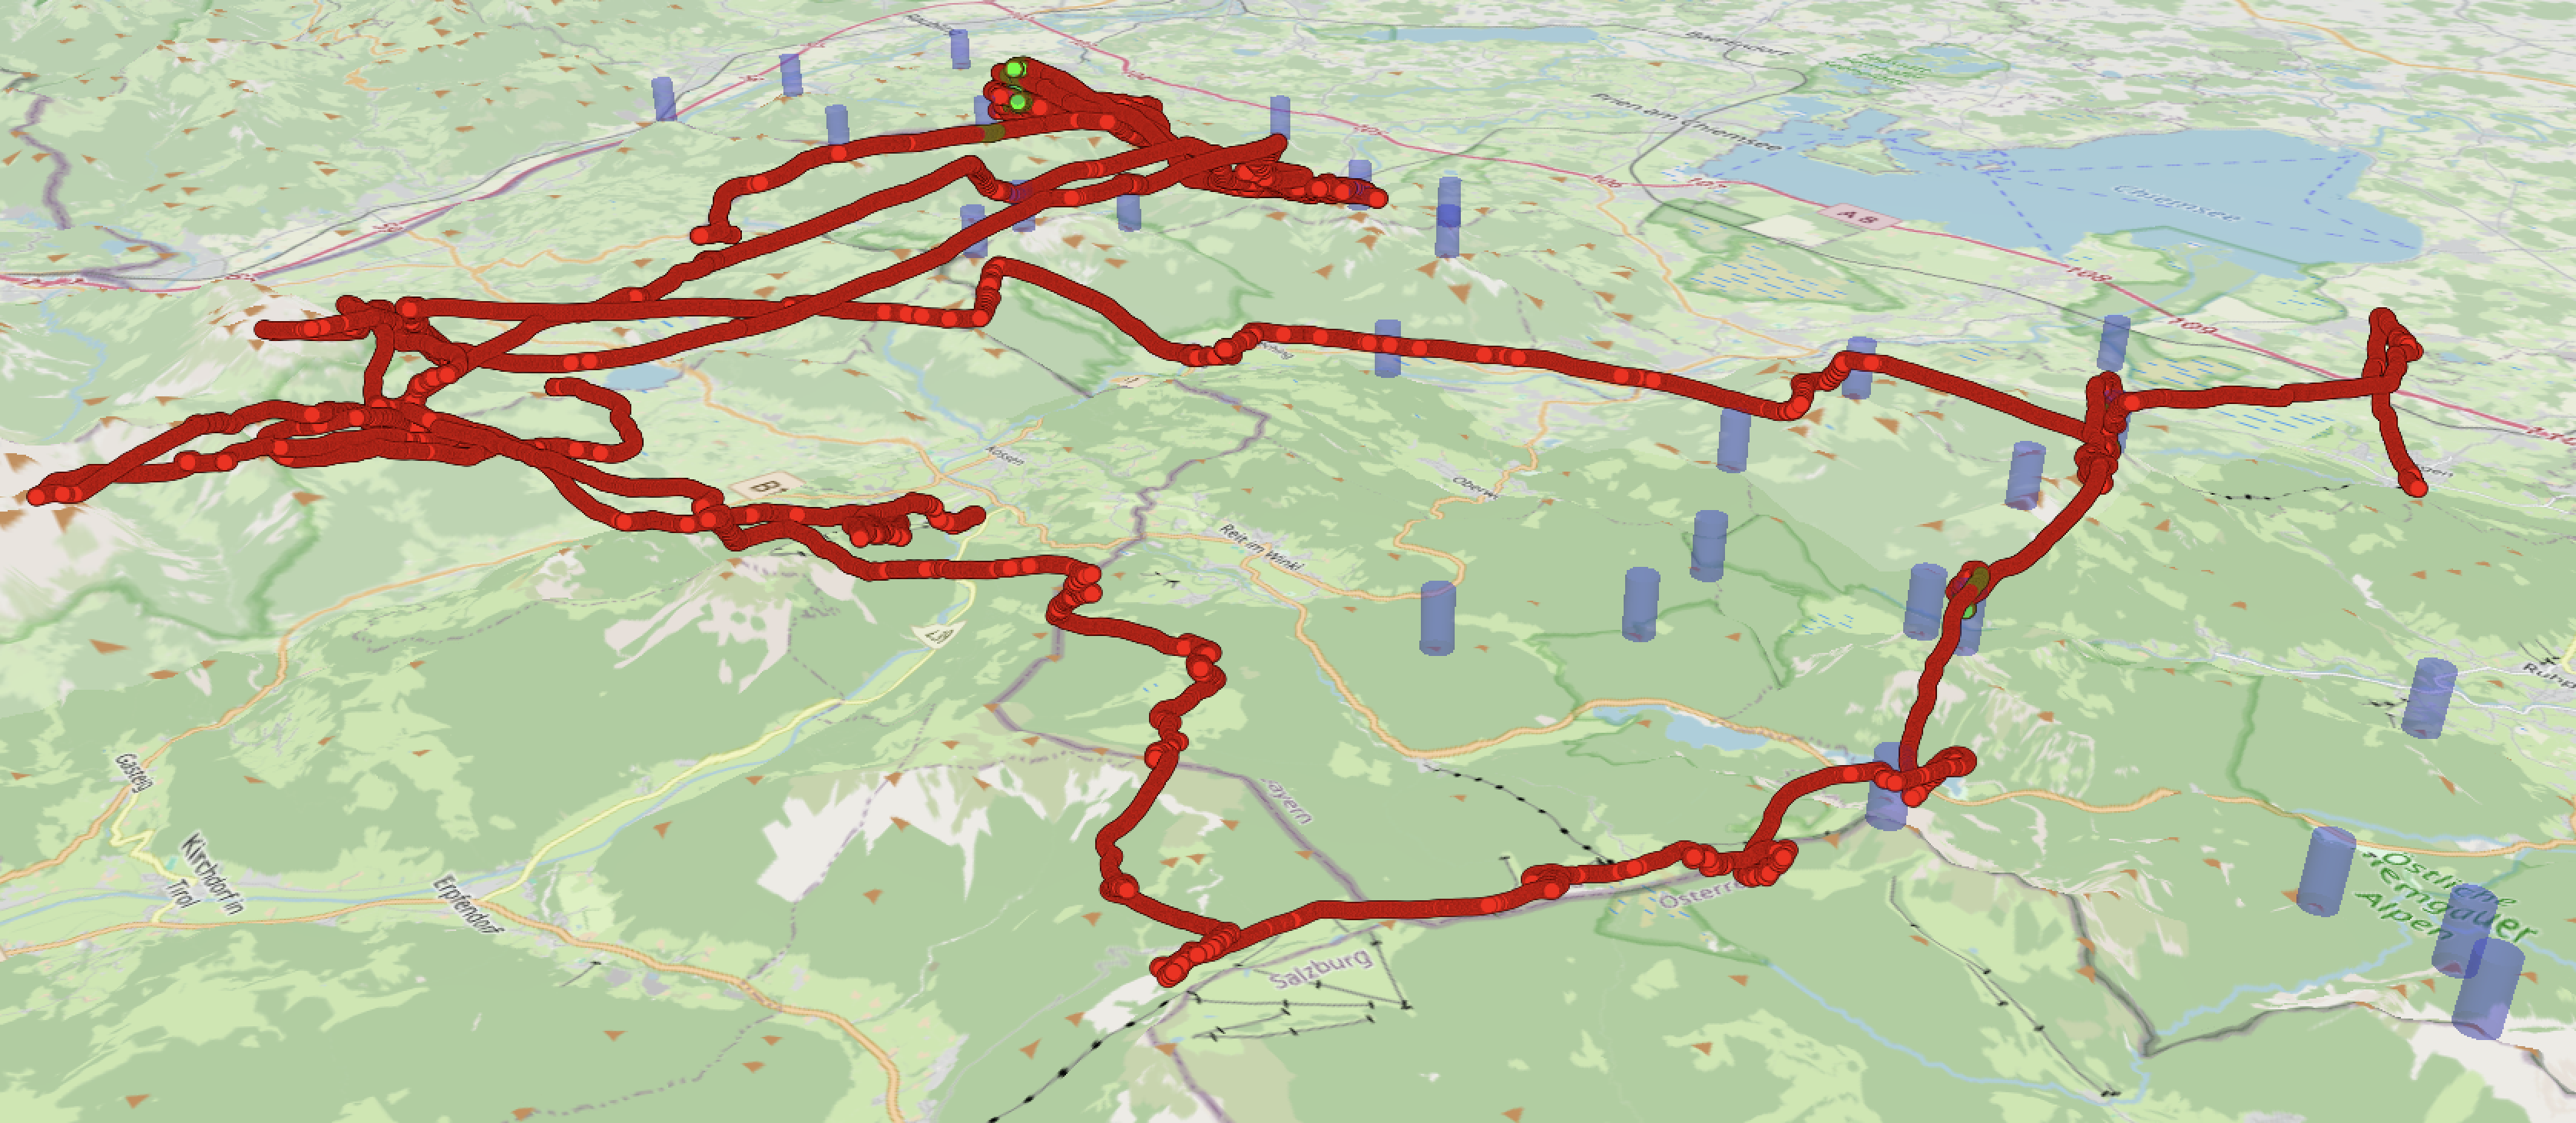
3D Visualization
For the spectators, a 2D map doesn’t do justice to paragliding. I used CesiumJS to render the terrain and flight paths in 3D. An absurdely simple Cloud Function generates a static HTML file with the flight data embedded and uploads it to Google Cloud Storage, from where it can be served directl via our homepage.
Conclusion
Building the Summit Race tracker was a fantastic exercise in utilizing modern Python GIS tools in a serverless environment. The system handled the race day load effortlessly, providing near real-time updates to the flight crews and fans. Despite the quite simple technologies involved, we were able to deliver a continous, reliable and engaging experience for the athletes and spectators alike - whereas other formats such as the Red Bull X-Alps still have to fight with tracking-issues over and over again 😊
Check out the Summit Race website for more details on the event.